Application
An overview of sites that drill down to individual assets providing real-time data and status of the gas turbines. The application is configured using:
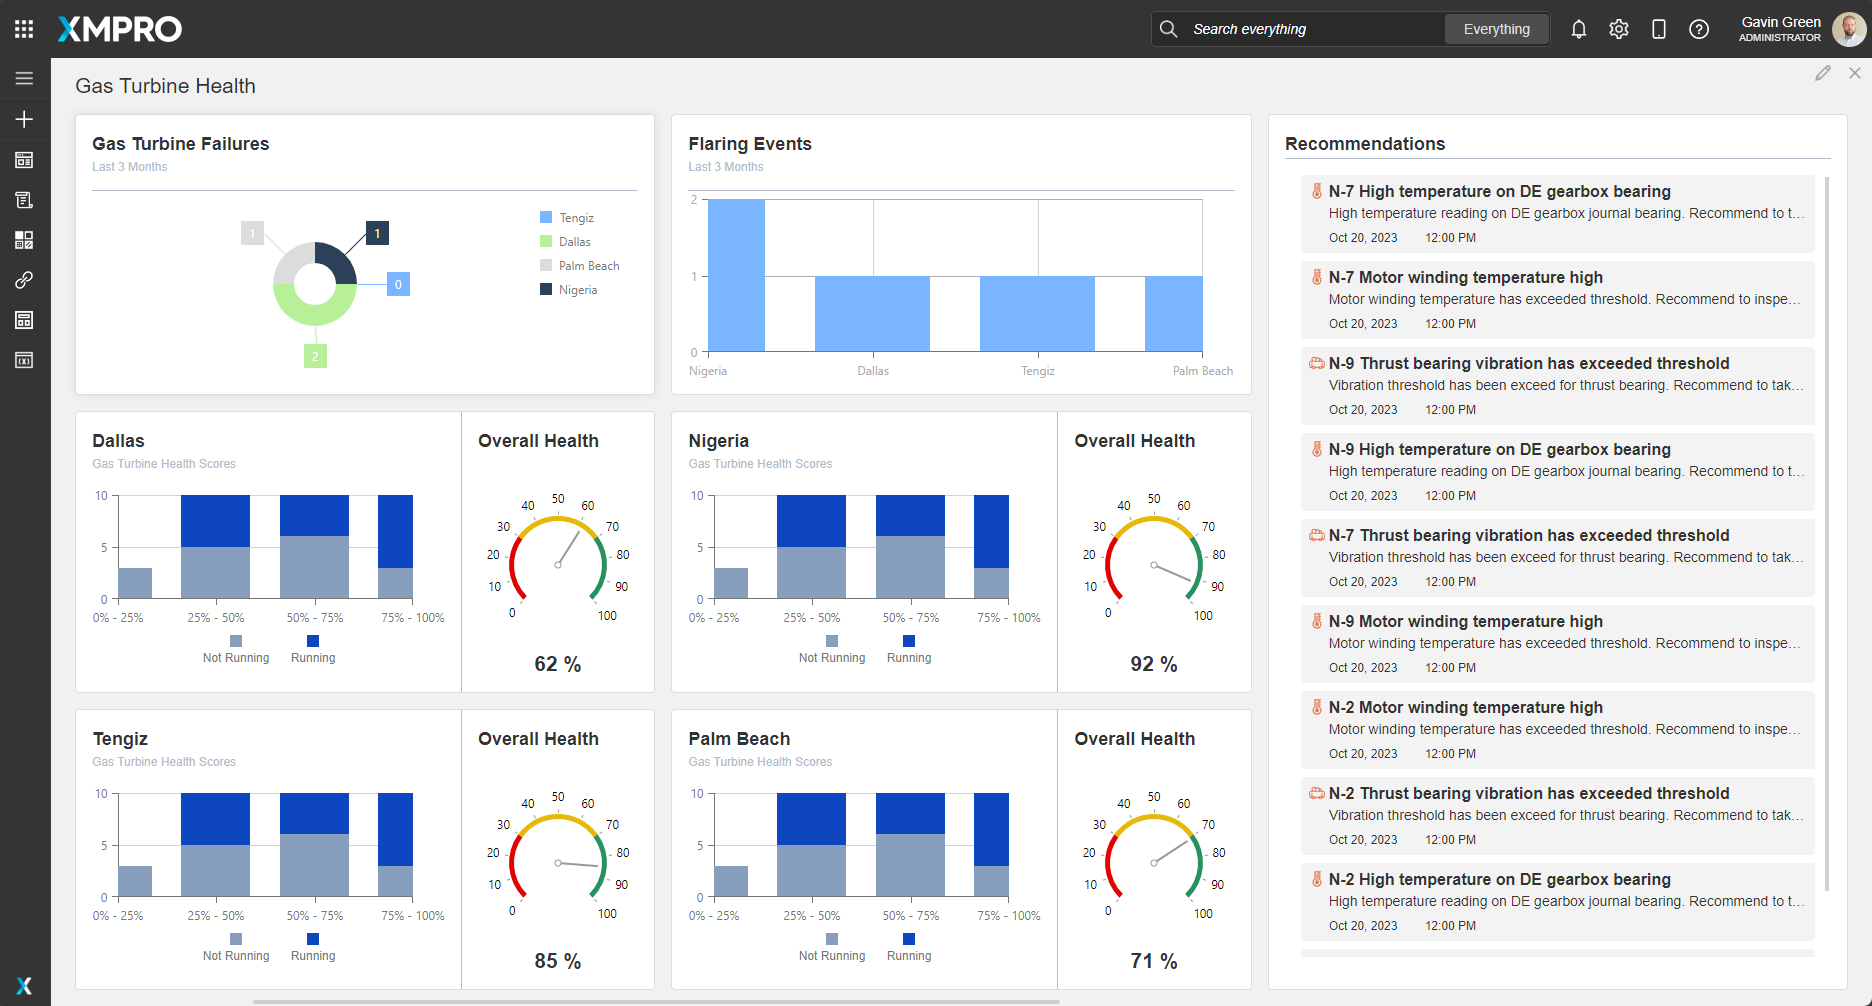
Landing Page
| Block | Description |
|---|---|
| Pie Chart | To display the failure counts for all sites |
| Chart |
|
| Circular Guage | To display the failure counts for all sites |
| Recommendations | To view current open recommendations for all assets |
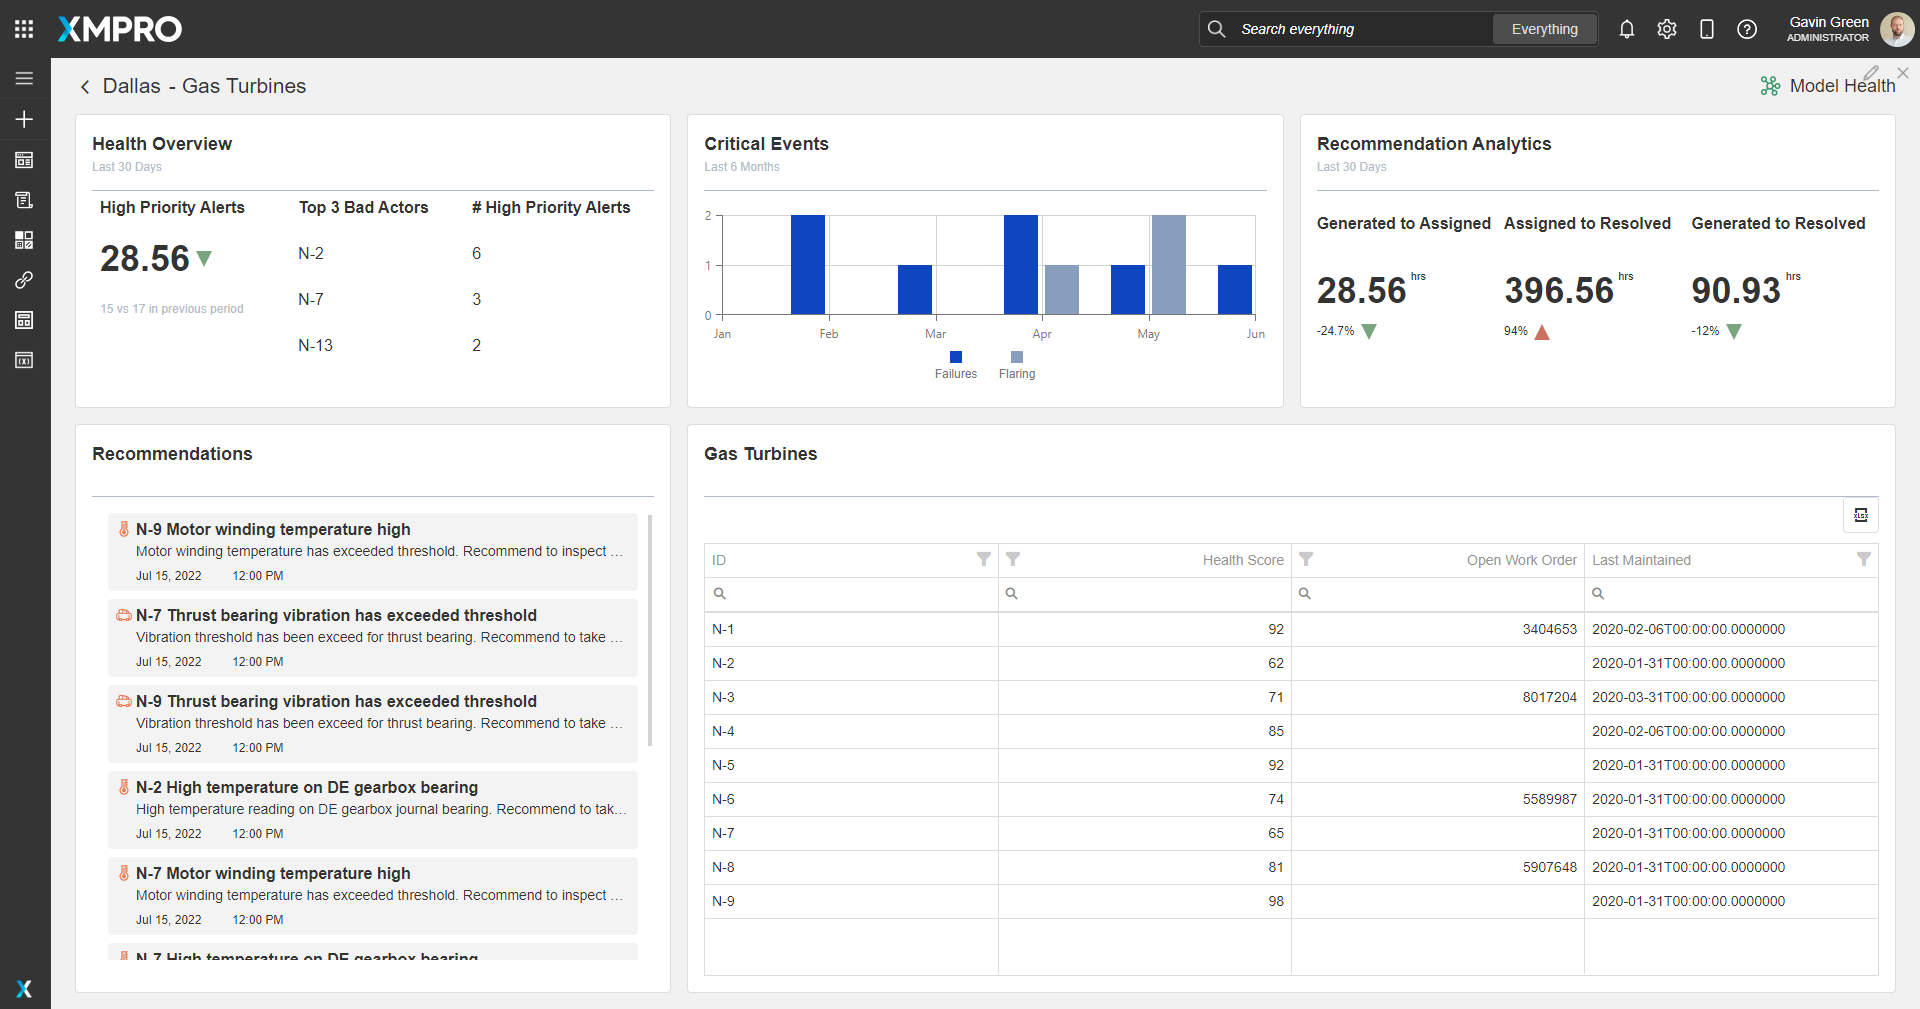
Site View
| Block | Description |
|---|---|
| Indicator | To display the failure counts for all sites |
| Chart | A bar graph to display flaring events |
| Data Grid | Presenting the data for each asset |
| Recommendations | To view current open recommendations for all assets |
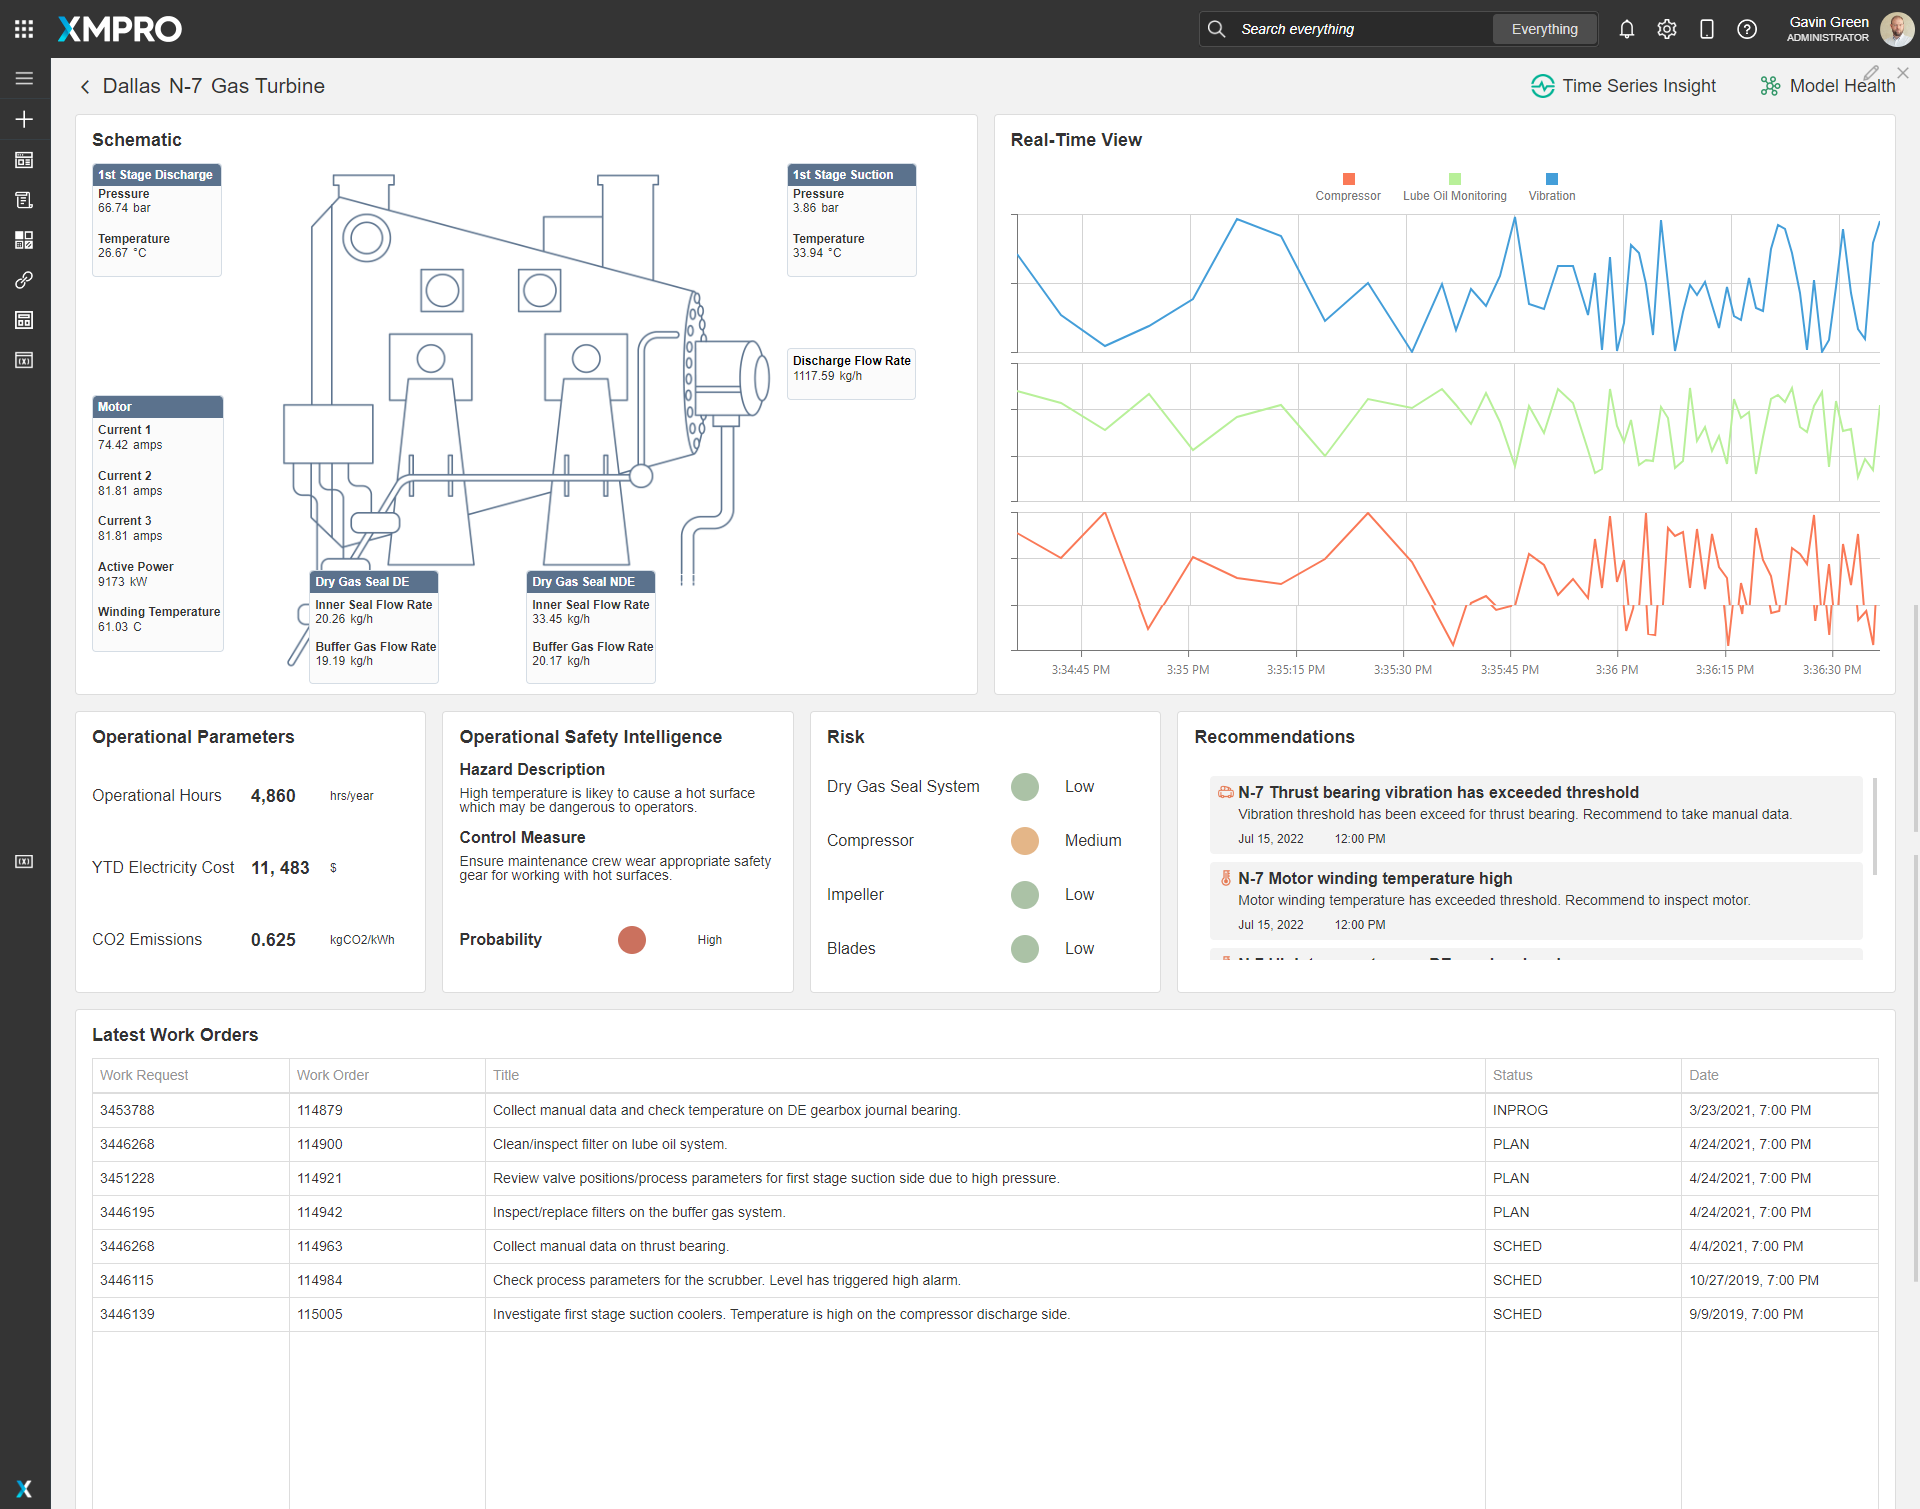
Gas Turbine
| Block | Description |
|---|---|
| Text | To display the live data |
| Chart | To display a window of live data |
| Indicator |
|
| Recommendations | To view current open recommendations for the current asset |
| Data Grid | Displaying the latest work orders |
Model View
| Block | Description |
|---|---|
| D3 | To display an anomaly detection graph |
Recommendations
The recommendation is configured using four rules across three recommendations:
Data Stream
An example of how to contextualize simulated data, broadcast the data, run recommendations and output the gas turbine data to the Application Designer. The data stream is configured using:
| Agent | Description |
|---|---|
| Event Simulator | Simulates the data within the thresholds configured |
| Calculated Field | Adding Asset Ids |
| Broadcast | Broadcast data to other agents |
| Round | Rounding all values |
| XMPro App | View data in the App Designer |
| Run Recommendation | Pass the data to the Recommendation engine to evaluate |
Steps to Import
1. Create/confirm variables
Ensure the following variables are available to be used in the data stream:
- App Designer URL
- App Designer Integration Key (Encrypted)
- SQL Server
- SQL Username
- SQL Password (Encrypted)
2. Run SQL Scripts
- Execute the scripts in SQL Server
- Ensure the data is successfully loaded into the database
3. Import the Data Stream
- Select the highest agent version number on import, if prompted
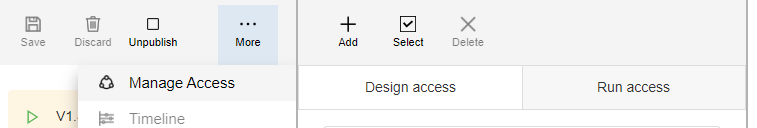
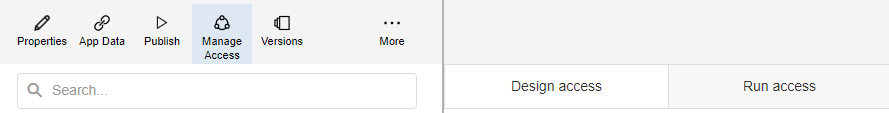
- Assign Access to others as required
- XMPro agents (
 ) - ensure the URL & Integration Key are selected
 - Recommendation agent (
 ) - ensure the URL & Integration Key are selected
 - Click Apply and save the data stream
- Publish the data stream and open the live view
- Ensure there is data in the live view by monitoring the agents
4. Import the Recommendations
- Mark the included form if it doesn’t already exist and map the data stream to import
- Assign Access to others as required
5. Import the Application
- Map the data source on import:
- Gas Turbine:
Data Source Name Data Stream Agent Option Live Chart Telemetry Gas Turbine Telemetry Send to App Designer for chart Live Telemetry Gas Turbine Telemetry Send to App 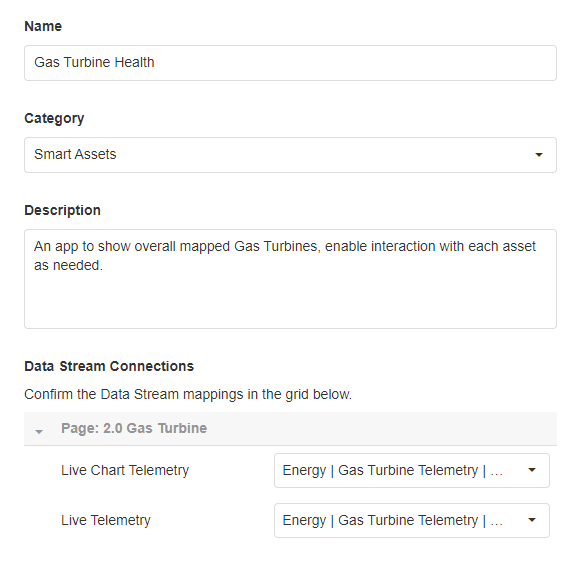
- Assign Access to others as required
- Ensure the App Data connection properties are configured and valid
-
Edit the application to link the recommendations (Select Bearing Alerts, Motor Winding Temperature, Dry Gas Seal System in Block Properties under Behavior)
Page Location Landing Page Right Site View Bottom Left Gas Turbine Bottom Right - Save the application
- Publish the application
- Ensure there is data in the application and that the Unity model is receiving its data by hovering over and observing the values